CrossCountry Mortgage Lenders in Philadelphia, PA
CrossCountry Mortgage is serving Philadelphia neighborhoods for over 50 years. We are proud to provide mortgage loans for minorities and first time home buyers assistance programs. Select one of our local loan officers below to get started.
Loan Officers in Philadelphia
Showing 19 to 22 of 22 results

Dave Kuhn
- Senior Loan Officer
- NMLS #143984
- 1560 Lititz Pike
- 2nd Floor
- Lancaster, PA 17601
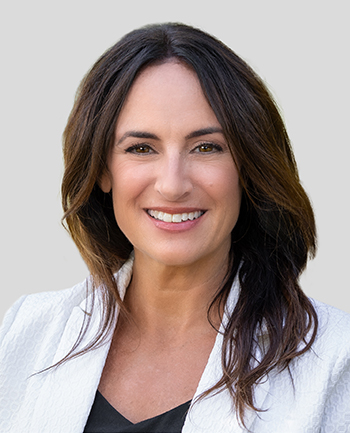
Dana Civa
- Senior Loan Officer
- NMLS #1903252
- 306 W Cuthbert Blvd
- Suite 201
- Haddon Township, NJ 08108

Crystal Hong
- Outside Loan Originator
- NMLS #1573775
- 1216 N Front Street
- Philadelphia, PA 19122

Billy McElroy
- Originating Branch Manager
- NMLS #48244
- 373 Egg Harbor Rd.
- Store #5
- Sewell, NJ 08080
Explore Philadelphia
Population
999
Rankings
Real Estate Insights
Median Home Value
$61,900
National Average: $244,900
Median Home Rent
$608
National Average: $1,163
Top Public Schools
Top Private Schools
Residents
Gender
Diversity
Age
Racial Diversity
Education
Household Income
How much will your mortgage payment be?
Enter the basic loan terms (and additional information if you wish) to calculate your monthly mortgage payment and see a breakdown by category.
This calculator is being provided for educational purposes only. The results are estimates based on information you provided and may not reflect CrossCountry Mortgage, LLC product terms. The information cannot be used by CrossCountry Mortgage, LLC to determine a customer’s eligibility for a specific product or service.